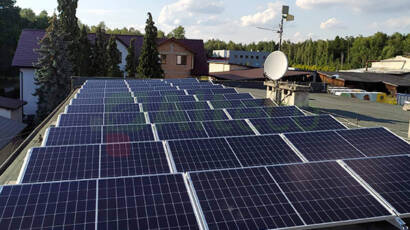
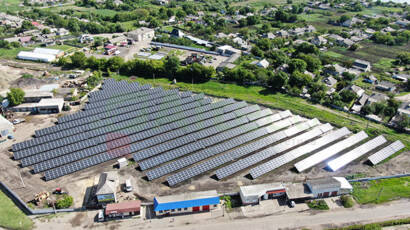
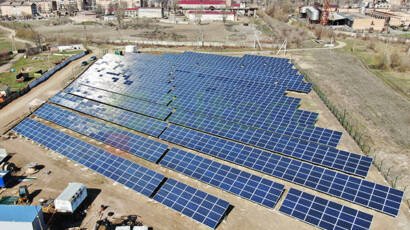
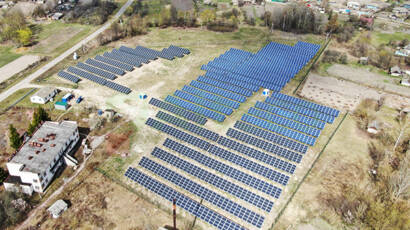
In 2020, the share of wind farms and solar power plants in the structure of electricity production has doubled – to 6.8% (3.3% in 2019) with a total electricity production of 148.9 billion kWh. The installed capacity of these renewable energy sources during the year increased by 1.9 GW (+ 41% compared to 2019).
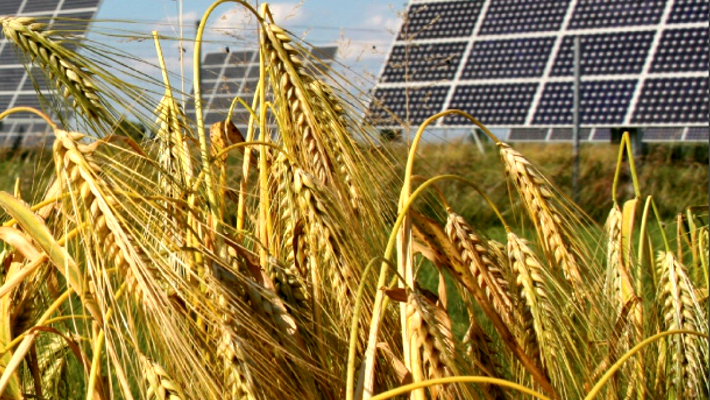
The installed capacity of solar power plants increased the most, the peak production of which in the spring-summer the period falls on the hours of daily consumption reduction (from 12:00 to 17:00), which requires flexible tools to balance them. The balancing of renewable energy sources, mainly solar power plants, during the day was last year and remains today the main problem of integration of renewable energy sources into the energy system of Ukraine.
Dynamics of installed capacity volumes and share in total production of wind farms and solar power plants
| Installed capacity, MW (%) | Volumes and share in total production, billion kWh (%) | |||||
| 2019 | 2020 | ∆ | 2019 | 2020 | ∆ | |
| Solar power plants | 3555,4 | 5362,6 | +1807,2 (+50,8%) | 3,1 | 6,8 | +3,7 (4,6%) |
| Wind farms | 1025,0 | 1111,2 | +86,2 (+8,4%) | 2,0 | 3,3 | +1,3 (2,2%) |
| Total | 4580,4 | 6473,8 | +1893,4 (+41%) | 5,1 | 10,1 | +5 (6,8%) |
At the same time, in 2020, the transmission system operator (TSO) and distribution system operators (DSO) issued a total of technical conditions for connection to the United Energy System of Ukraine networks of a new generation of renewable energy sources with an installed capacity of 1374.95 MW, of which 1035.7 MW – up to networks of the distribution system operator, where solar electrostatics account for 78%. That is, the growth of capacity with renewable energy sources will continue and accordingly increase the share of renewable energy sources in the structure of electricity production.
Technical conditions are issued for the connection of solar power plants and wind farms in 2020, MW
| Total | To TSO networks | To DSO networks | |
| Solar power plants | 1030,45 (75%) | 810 (78%) | 220,45 (65%) |
| Wind farms | 145,20 (11%) | 77,9 (8%) | 67,3 (20%) |
| Others | 199,3 (14%) | 147,8 (14%) | 51,5 (15%) |
| Total | 1374,95 | 1035,7 | 339,25 |
 At the same time, the installed capacity of heat and hydro generation remains virtually unchanged, which today are key in covering peak and semi-peak loads. In such conditions, a critical factor is to provide thermal generation with the required amount of coal.
Installed generation capacity in 2017-2020.
| Type of generation / GW | 2017 | 2018 | 2019 | 2020 |
| Thermal power station (TPS) | 24,6 | 21,8 | 21,8 | 21,8 |
| Combined heat and power (CHP) | 6,0 | 6,1 | 6,1 | 6,1 |
| Hydroelectric power station (HPS) | 4,7 | 4,8 | 4,8 | 4,8 |
| Pumped-storage hydroelectricity (PSH) | 1,5 | 1,5 | 1,5 | 1,5 |
Heat and hydro generation are the key control tools that today provide the possibility of integrating renewable energy sources into the power system and allow to compensate for the sharply changing (stochastic) mode of its operation, giving the power system shunting power.
The combination of these factors against the background of the general decline in electricity consumption (in particular related to the introduction of quarantine measures) has led to a significant increase in the number of cases of limited generation under the command of the solar power plants and wind farms dispatcher.
